I have a variety of research interests that I pursue here and at the Information Science Department of the University of Pittsburgh. Currently, I am interested in applying visualization tools to the task of understanding abstract and non-spatial data. In particular I am investigating the visualization of software in order to enhance understanding of its structure to allow faster and more accurate maintenance. At this point I am calling this visualization"software blueprints".
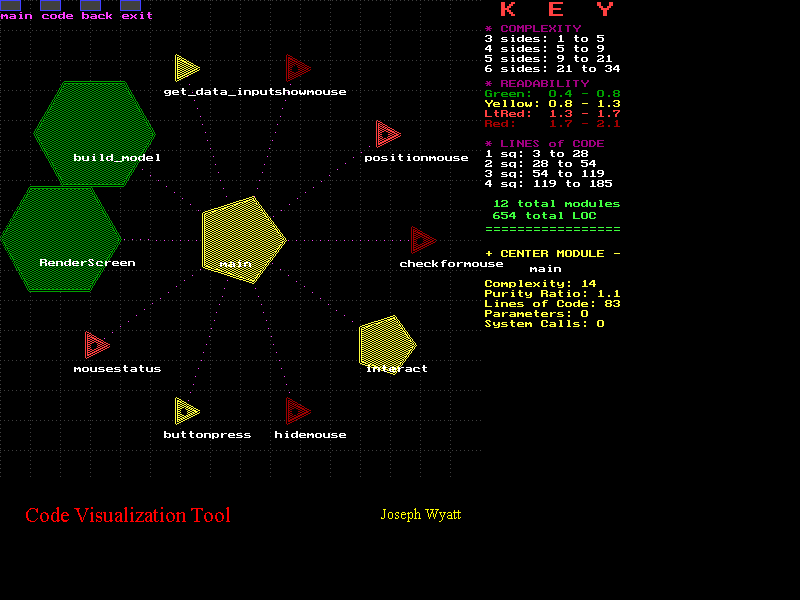
The following screen-shot shows a portion of the tool I built that allows navigation among modules thatare represented according to representative metric measurements taken directly from the code.
Software Blueprints:Visualization of Program Metrics for Maintenance

The above visualization shows a portion of a large program written in the "C" programming language.The center module, "main", is shown surrounded by the modules that it calls. Metric information about these modules is shown visually and in the key to the right of the display. The shape of the visual objectshows the relative complexity of the code while the size of the objects indicates the number of lines of source code. An additional metric that is derived from the code is called a readablity index and is representedby the object color. These metrics have been demonstrated to be a reliable indicator for code maintainability.
Clicking on the "code"button in the upper left of the display allows the actual source code that has generated the display to be viewed.
Clicking on one of the modules which are organized on the perimeter of the central object will change the display so that that module will become the central visual object and the modules that it calls will be shown on its perimeter.
A programmer trying to understand a program or section of program so that she can do maintenance, can usethe tool to try to gain some basic comprehension of the nature of the modulesand an understanding of the structure and relationships among the modules.This understanding can be confirmed by actual code inspection while using the tool to navigate the structure.